
Showing posts with label Angels. Show all posts
Showing posts with label Angels. Show all posts
Friday, July 5, 2013

Friday, May 3, 2013

Friday, April 26, 2013
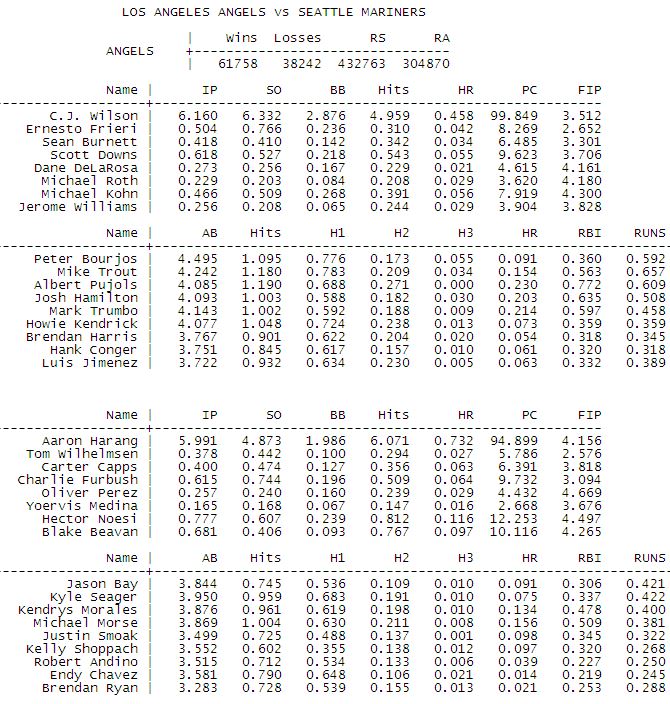
Sunday, April 21, 2013

Thursday, April 18, 2013
Tigers vs Angels - April 19th Simulation Results

Top 20 Most Likely Final Scores
1. LAA 3-2
2. LAA 4-3
3. LAA 5-4
4. LAA 2-1
5. DET 3-2
6. DET 4-3
7. LAA 4-2
8. LAA 3-1
9. DET 4-2
10. LAA 6-5
11. DET 2-1
12. DET 5-4
13. LAA 5-3
14. DET 5-3
15. LAA 5-2
16. DET 3-1
17. DET 5-2
18. LAA 4-1
19. DET 4-1
20. DET 6-5
Wednesday, April 17, 2013
Angels vs Twins - April 17th Simulation Results

Top 20 Most Likely Final Scores
1. MIN 3-2
2. MIN 4-3
3. MIN 2-1
4. LAA 3-2
5. LAA 4-3
6. LAA 2-1
7. MIN 5-4
8. LAA 4-2
9. LAA 3-1
10. MIN 4-2
11. LAA 5-3
12. MIN 3-1
13. LAA 5-4
14. LAA 5-2
15. LAA 4-1
16. MIN 6-5
17. MIN 5-3
18. MIN 4-1
19. LAA 6-3
20. LAA 2-0
Notes about simulator:
It uses Zips projections as data inputs and then plays actual baseball games taking into account pretty much anything you can think of including, defense, base running, handedness advantages, park factors, pitchers tiring, leverage index for bullpen usage. The lineups come from MLBDepthCharts and since the simulations are done before the actual lineups are published there may be some slight differences between the lineup the simulation uses and the actual one. Each game is simulated 100k times and the average box scores are listed above.
Friday, April 12, 2013

Wednesday, April 10, 2013


Tuesday, April 9, 2013
Athletics vs Angels - April 9th Simulation Results
Here is a screenshot of the results of today's simulation of the Athletics vs Angels game. Please keep in mind that the simulation was ran before the lineups were announced. The lineups should be close but not an exact match of the actual ones. This game was simulated 100K times.

Friday, April 5, 2013
Angels vs Rangers - April 5th Simulation Results
Here are the simulation results for the April 5th game between the Angels and the Rangers.
Angels (1-2) vs Rangers (2-1)
Jason Vargas vs Derek Holland
Record: 1-2 (0.333)
RS: 11
RA: 11
Pythag Win%: 0.500
Pythag Pace: 81- 81
Pythag Record: 1.5 - 1.5
Record As Favorites: 0-1
Record As Underdogs: 1-1
Simulation Results Notes:
Angels win expectancy is 51.73%
Angels on average score 5.72 runs
Rangers on average score 5.23 runs
Total Runs scored on average: 10.95
Starting Pitching Lines:
Jason Vargas - 5.4ip, 3.3so, 1.8bb, 6.7hits, 1.07hrs, 88pitches, 5.554fip
Derek Holland - 5.4ip, 5.1so, 1.9bb, 6.3hits, 1.15hrs, 90pitches, 5.097fip
Some numbers from the Vegas odds:
Angels win expectancy: 47.28%
Over/Under: 10.0 -110o +100u
Notes: This looks like a high scoring game.
Top 20 Most Likely Final Scores:
1. Rangers 5-4
2. Rangers 4-3
3. Rangers 6-5
4. Rangers 3-2
5. Angels 5-4
6. Angels 4-3
7. Rangers 7-6
8. Angels 6-5
9. Angels 5-3
10. Rangers 5-3
11. Angels 6-4
12. Angels 3-2
13. Rangers 6-4
14. Rangers 4-2
15. Angels 4-2
16. Angels 6-3
17. Angels 7-6
18. Rangers 8-7
19. Angels 7-5
20. Rangers 6-3
.
.
100. Angels 11-2
Thursday, April 4, 2013
Monday, April 1, 2013
Angels vs Reds, Opening Day Simulation Results
Here are the simulation results for the opening day game between the Angels and the Reds.
Angels vs Reds
Jered Weaver vs Johnny Cueto
Simulation Results Notes:
Angels win expectancy: 44.32%
Angels on average score 3.42 runs
Reds on average score 3.72 runs
Total Runs scored on average: 7.14
Starting Pitching Lines:
Jered Weaver - 6.0ip, 6.3so, 1.8bb, 6.1hits, 0.8hrs, 97pitches, 3.763fip
Johnny Cueto - 6.5ip, 6.3so, 1.5bb, 6.4hits, 0.6hrs, 100pitches, 3.173fip
Angels player most likely to hit a HR: Josh Hamilton
Reds player most likely to hit a HR: Jay Bruce
Angels hitter most strikeouts: Josh Hamilton (1.3 times)
Reds hitter most strikeouts: Ryan Ludwick (1.2 times)
Angels hitter most walks: Chris Iannetta (0.385 times)
Reds hitter most walks: Joey Votto (0.656 times)
Some numbers from the Vegas odds:
Angels win expectancy: 47.96%
Over/Under: 7.5 110o -120u
Top 20 Most Likely Final Scores:
1. Reds 3-2
2. Reds 4-3
3. Reds 2-1
4. Angels 3-2
5. Reds 5-4
6. Angels 2-1
7. Angels 4-3
8. Reds 3-1
9. Reds 4-2
10. Angels 4-2
11. Angels 3-1
12. Reds 4-1
13. Reds 1-0
14. Reds 5-3
15. Reds 5-2
16. Angels 5-4
17. Angels 4-1
18. Angels 5-3
19. Reds 6-5
20. Reds 2-0
.
.
98. Angels 9-0
Monday, December 24, 2012
Best Lineup - Los Angels of Anaheim
In my previous post I used my baseball simulator to look at the best lineup for the Cincinnati Reds vs both a LH/RH pitcher. Up at the plate this time are the Angels. Keep in mind that the input projections I am using are from Bill James and the input projections go a long ways in determining which lineup is the best. What you will see with the Angels, which may look odd to some people, is the placement of their catcher Chris Iannetta in the lineup. Iannetta is one of those players with unspectacular statistics but he has put up some pretty impressive OBP numbers. Let's take a look at the results and then analyze a little bit what is going on.
Sunday, December 16, 2012
Where To Bat Your Best Hitter - Part II
In Part I of this exercise I looked at the best lineup construction for a team that had one Albert Pujols and eight Michael Bourn's. I then plugged these lineups, using Bill James player projections into my baseball simulator. The lineup that won the most games had Albert Pujols batting third.
In the next step of this exercise I replaced one of the Michael Bourn's with another Albert Pujols. What lineup with two Albert Pujols' in it would win the most games? Logic would tell you that one of the Albert Pujols' should be batting third, right? If so, then where would you slot in the second Pujols? Let's take a look at the 36 total permutations of lineups and see which ones did best. Once again, one million games were simulated.
Friday, December 14, 2012
Where To Bat Your Best Hitter - Part I
In this exercise I use my simulator to determine where to bat your best hitter in the lineup... but with a twist. I am taking a team of nine hitters, eight of which are a typical speedy leadoff hitter (in this case I am using Michael Bourn) and the ninth is Albert Pujols. Throw defense out the window in this exercise, just look at which lineup construction with eight Bourn's and one Pujols' would win you the most games.
There are only nine different permutations. Pujols can bat anywhere from leadoff to ninth in these lineups. Which slot do you think would be the best place to put Pujols. My simulator takes in to consideration all offensive traits (hitting, speed) with the hitting projections coming from Bill James projections which are the only ones out at this point.
Results after the jump....
Best Lineup vs RHP
So, the Angels just signed Josh Hamilton to a new five year deal. Now, it is time to take a look at what the most efficient lineup should be. Today I tackle that exercise in a look at how the Angels sluggers should be stacked up against your typical right handed pitcher.
To do this, I am whipping out my simulator which plays actual baseball games using sabermetric principles. Each worthy lineup will be simulated one million times in a game against an opponent that remains constant, with a right handed pitcher. The Angels will be the away team in all these simulations to give them at least nine innings of at bats in each game. I picked a group of opponents such that the game results are close to 50% wins and losses for the Angels.
I used the starting nine players as listed at the Angels MLB Depth Charts page. The measurement to determine the best lineup will be number of wins out of a million games. Now, I did not try every single permutation of possible lineups so the exercise is not totally complete but after you play around with switching the lineups around you can quickly narrow down the best ones. Bill James 2013 player projections were used for input.
Below is the best lineup that I found.
1) Mike Trout
2) Josh Hamilton
3) Albert Pujols
4) Kendrys Morales
5) Mark Trumbo
6) Erick Aybar
7) Howie Kendrick
8) Alberto Callaspo
9) Chris Iannetta
This lineup won 523636 out of one million games. For reference the lineup that MLBDepthCharts provides with Aybar hitting second, Hamilton 4th with Morales and Trumbo pushed down one slot wins a total of 522341 games. The question then becomes, how significant is this? Over a 162 game season, this would net the Angels an extra 0.21 wins. This is obviously an amount not worth fretting over. The big differences come when you totally screw around with the lineup which not even Scoscia would dare do.
Here is a breakdown of how the box score broke down for this lineup.
| Name | AB | Hits | H1 | H2 | H3 | HR | RBI | RUNS | BB | SO | wOBA |
|---|---|---|---|---|---|---|---|---|---|---|---|
| Mike Trout | 4.344 | 1.144 | 0.724 | 0.195 | 0.047 | 0.179 | 0.475 | 0.285 | 0.410 | 1.246 | 0.339 |
| Josh Hamilton | 4.201 | 1.035 | 0.563 | 0.217 | 0.013 | 0.242 | 0.633 | 0.189 | 0.466 | 1.499 | 0.344 |
| Albert Pujols | 4.101 | 1.156 | 0.643 | 0.295 | 0.000 | 0.217 | 0.660 | 0.180 | 0.452 | 0.640 | 0.372 |
| Kendrys Morales | 4.217 | 1.094 | 0.679 | 0.250 | 0.007 | 0.159 | 0.556 | 0.140 | 0.260 | 1.074 | 0.319 |
| Mark Trumbo | 4.135 | 0.961 | 0.554 | 0.200 | 0.009 | 0.198 | 0.524 | 0.144 | 0.218 | 1.284 | 0.300 |
| Erick Aybar | 4.036 | 1.059 | 0.771 | 0.215 | 0.031 | 0.043 | 0.289 | 0.201 | 0.203 | 0.640 | 0.292 |
| Howie Kendrick | 3.956 | 0.982 | 0.653 | 0.249 | 0.012 | 0.068 | 0.364 | 0.159 | 0.161 | 1.045 | 0.283 |
| Alberto Callaspo | 3.670 | 0.960 | 0.689 | 0.206 | 0.013 | 0.051 | 0.335 | 0.149 | 0.346 | 0.510 | 0.310 |
| Chris Iannetta | 3.475 | 0.710 | 0.415 | 0.165 | 0.005 | 0.125 | 0.384 | 0.128 | 0.435 | 1.191 | 0.292 |
Subscribe to:
Posts (Atom)