
Friday, July 5, 2013
Friday, May 3, 2013

Friday, April 26, 2013
Sunday, April 21, 2013

Thursday, April 18, 2013
Tigers vs Angels - April 19th Simulation Results

Top 20 Most Likely Final Scores
1. LAA 3-2
2. LAA 4-3
3. LAA 5-4
4. LAA 2-1
5. DET 3-2
6. DET 4-3
7. LAA 4-2
8. LAA 3-1
9. DET 4-2
10. LAA 6-5
11. DET 2-1
12. DET 5-4
13. LAA 5-3
14. DET 5-3
15. LAA 5-2
16. DET 3-1
17. DET 5-2
18. LAA 4-1
19. DET 4-1
20. DET 6-5
Wednesday, April 17, 2013
Angels vs Twins - April 17th Simulation Results

Top 20 Most Likely Final Scores
1. MIN 3-2
2. MIN 4-3
3. MIN 2-1
4. LAA 3-2
5. LAA 4-3
6. LAA 2-1
7. MIN 5-4
8. LAA 4-2
9. LAA 3-1
10. MIN 4-2
11. LAA 5-3
12. MIN 3-1
13. LAA 5-4
14. LAA 5-2
15. LAA 4-1
16. MIN 6-5
17. MIN 5-3
18. MIN 4-1
19. LAA 6-3
20. LAA 2-0
Notes about simulator:
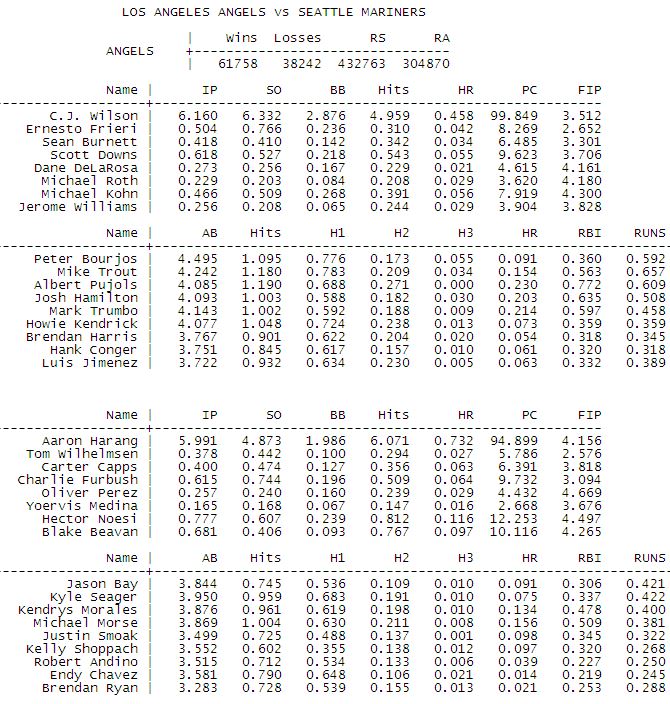
It uses Zips projections as data inputs and then plays actual baseball games taking into account pretty much anything you can think of including, defense, base running, handedness advantages, park factors, pitchers tiring, leverage index for bullpen usage. The lineups come from MLBDepthCharts and since the simulations are done before the actual lineups are published there may be some slight differences between the lineup the simulation uses and the actual one. Each game is simulated 100k times and the average box scores are listed above.
Friday, April 12, 2013

Subscribe to:
Posts (Atom)